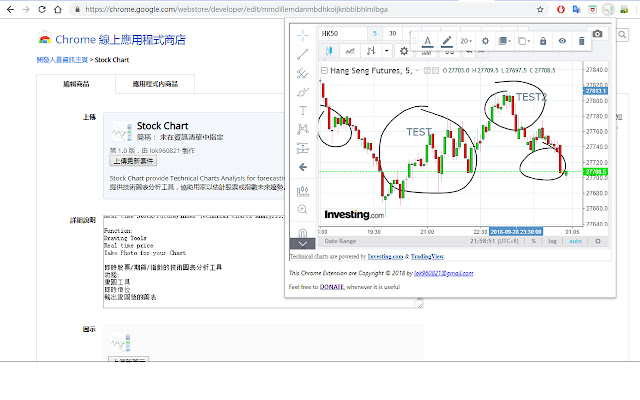
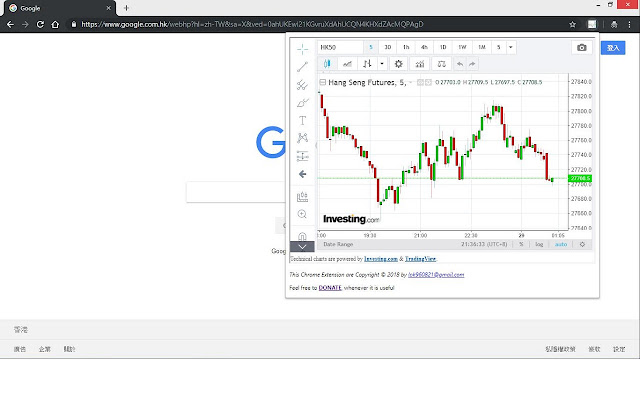
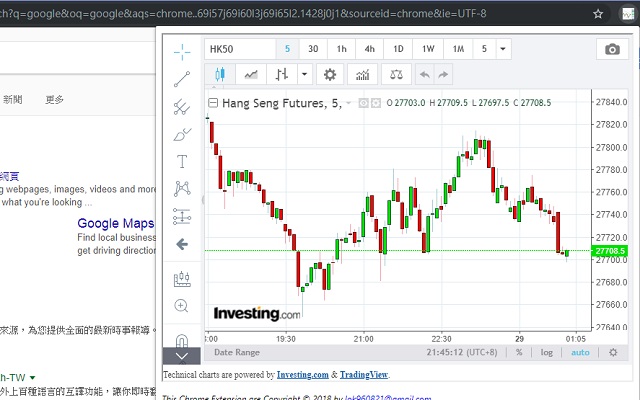
Real time Stock/Future/Index Technical Charts Analysis.
即时股票/期货/指数的技术图表分析工具
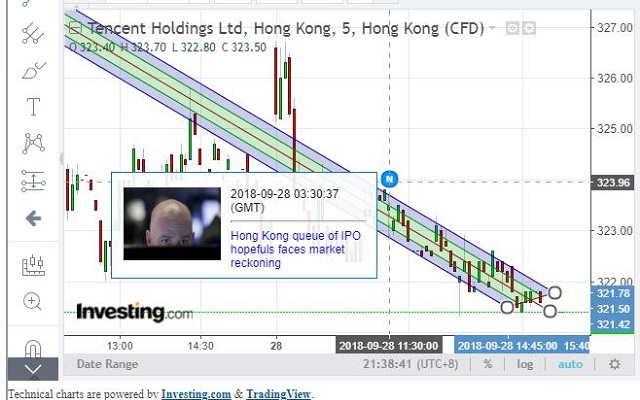
Function:
Drawing Tools
Real time price
Take Photo for your Chart
News of the Stock
功能:
画图工具即时价位输出画图后的图表股票新闻
即月期代号HK50
HSI 代号HONG KONG:HK50
港股搜寻格式:(XXXX) eg 0700
因图表是由Investing.com输出,有些港股未能显示出来可以在左上角Search
This Chrome Extension are Copyright © 2018 by lok960821@gmail.com
Technical charts are powered by Investing.com & TradingView
介绍
评分
4.5星(共5星),共6位用户参与评分
使用人数
597+ 位用户
版本
1.0
大小
39.69KB
分类
提供方
lok960821
支持语言
英语
发布时间
2023-03-03 23:32:28
ID
mmdillemdanmbdhkoijknbbibhlmlbga
